
Observability: Traces, Metrics and Evals
Tracing, metrics and evals: the frame around the pipeline that changes nothing and reveals everything.
Every other part of this guide changes a box inside the pipeline. This one builds the frame around it.
In the mental model from Part 1, observability is the band drawn around both phases:
Original ASCII
        ┌──────────────────────────────────────────────────────────┐
        │  OBSERVABILITY  (traces · metrics · evals · JSON logs)    │
        │  wraps everything, changes nothing            ch12,13,19  │
        └──────────────────────────────────────────────────────────┘
It is deliberately placed here, before the scaling and cost parts, and that ordering is a correction to the source course, which teaches it later. The reason is simple: every trigger in the parts that follow is a measurement. "Scale when p95 retrieval latency crosses 100 ms." "Route to a cheaper model when the question is trivial." "Add a cache when the hit rate would exceed X." None of those sentences mean anything to a team that cannot see a p95, a per-query cost, or a hit rate. Teaching optimization before instrumentation hands the reader thresholds they have no way to evaluate.
This part is also where invariant 4 (failures are silent) and invariant 6 (monitoring observes and must never change behaviour) get their full treatment. They are the same idea from two ends: because nothing throws, you must add the eyes yourself — and because the eyes are additive, they must never become part of the control flow.
One framing note before we start. The source material narrates this entire module in terms of a multi-agent LangGraph research system — supervisors, handoffs, parallel agents, hierarchical teams, quality loops — not a retriever. That segment is lifted from the instructor's LangChain/LangGraph material and dropped into a RAG course. Every argument still holds, because retrieve → filter → rerank → assemble → generate is just another multi-step graph with the same properties: multiple candidate failure sites, no exceptions, cascading corruption. But when the source says "which agent failed," read "which stage failed," and the examples in this part translate the agent vocabulary into RAG vocabulary wherever it matters.
The black box you just shipped
The scenario the source opens with is deliberately not "your code is broken" 02:21:11. The code works. The graph runs end to end. Supervisors dispatch, agents return, the report gets written. And you still cannot explain a single wrong answer.
The instructor poses a three-way blame question: when the output is wrong, was it the researcher that found bad data, the writer that misinterpreted it, or the supervisor that routed to the wrong department? You cannot tell from the output. That is the whole problem, stated in one sentence:
"Your system is a black box. You put a question in, an answer comes out, and if something goes wrong you are guessing." 02:21:11
Contrast with the debugging loop you already know. Traditional software: bug → stack trace → "line 47 is the problem" → fix it → done. The source calls that "a clear path." LLM software gives you a bad paragraph and nothing else.
"There's no stack trace for bad answers." 02:22:12
And "just read the code" does not scale, because the number of candidate failure sites grows with the graph. The example system is 5+ nodes, 3 parallel agents, quality loops, 8+ LLM calls per run 02:22:12. When the final report is wrong, which of those eight-plus calls produced the first wrong token? None of them announce themselves.
The RAG translation is exact. A single production query touches: the query rewriter, the embedding call, the vector search, the BM25 branch, the fusion step, the metadata filter, the reranker, the context assembler, and the generator. That is nine places a wrong answer can be born, and eight of them will happily return a syntactically perfect result while being semantically wrong.
Without instrumentation, the diagnostic procedure available to you is this one — and the source names it in order specifically so you will recognise yourself in it:
- Read the final output.
- Decide it's wrong.
- Guess which component caused it.
- Re-run and hope it reproduces.
"That's not engineering. That's just hope." 02:24:17
Why LLM debugging is hard — the four structural reasons
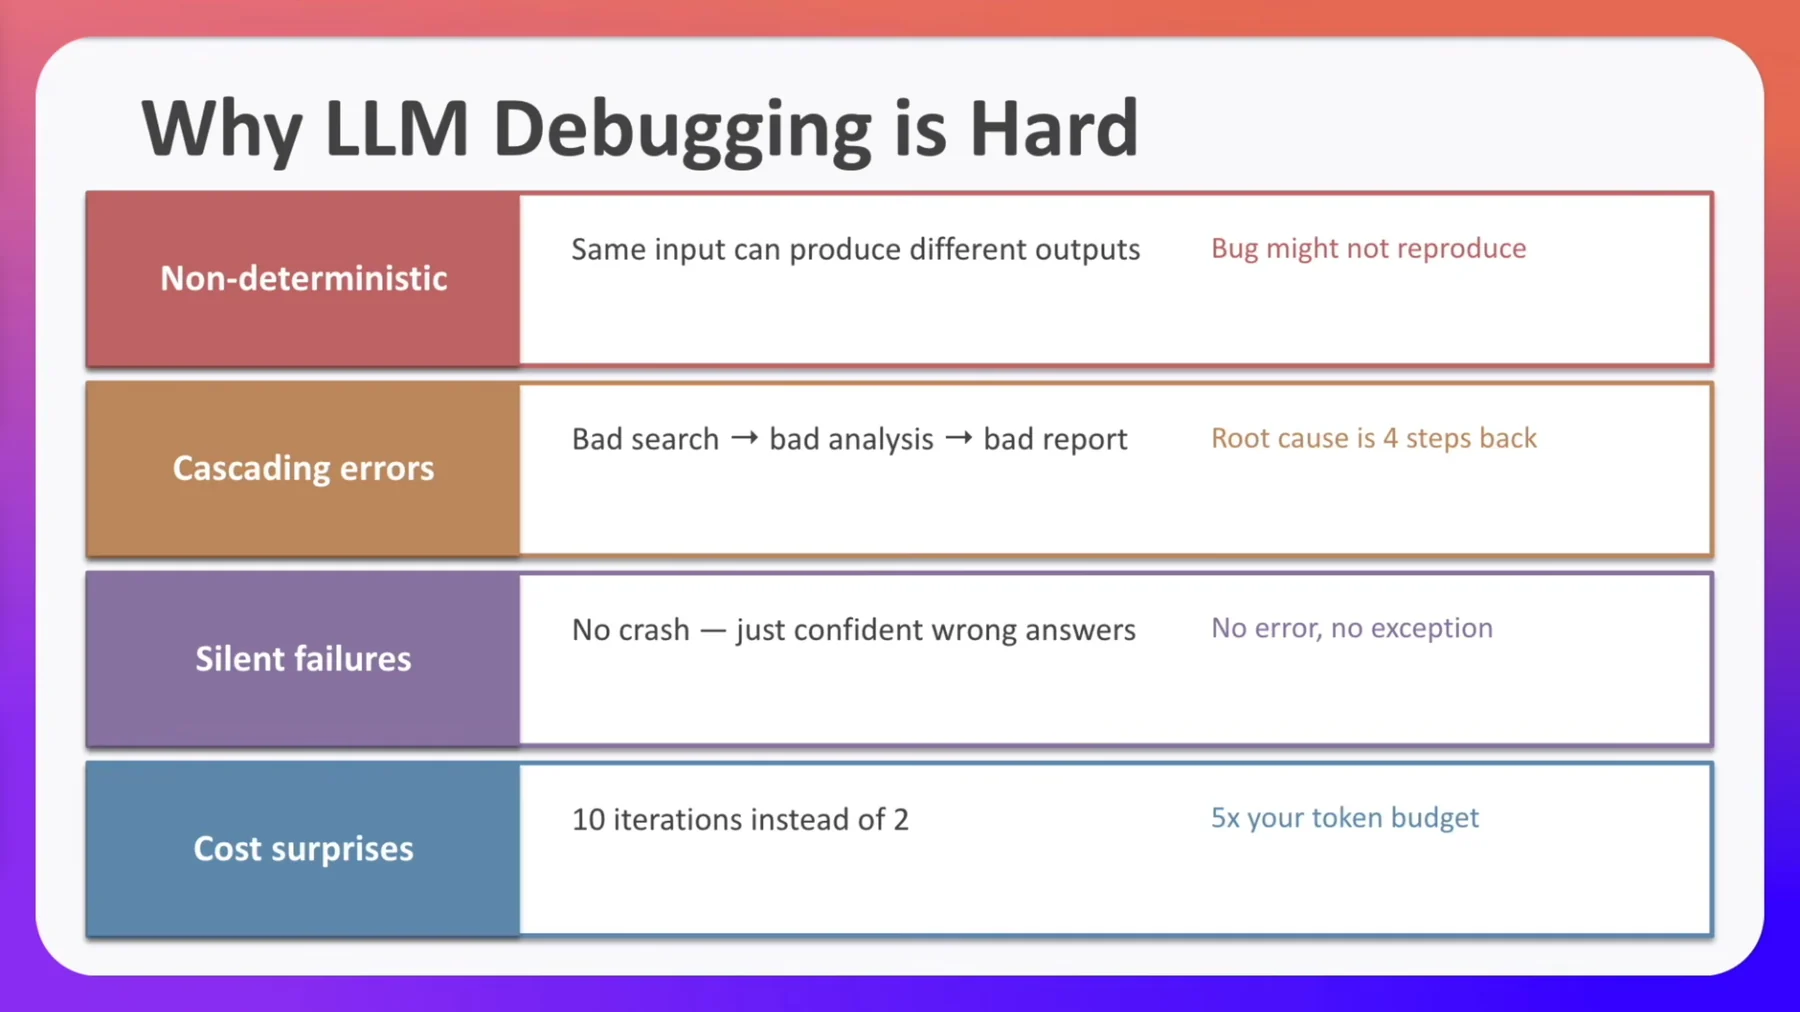
The slide is the conceptual spine of this part 02:22:12–02:24:17. Here it is with the RAG translation added, because the source only gives the agent version.
| Reason | Source's framing | Consequence (slide) | What it looks like in RAG |
|---|---|---|---|
| Non-deterministic | Same input can produce different outputs | "Bug might not reproduce" | Two identical questions return different answers; a chunk that ranked 3rd yesterday ranks 11th today after an index rebuild |
| Cascading errors | Bad search → bad analysis → bad report | "Root cause is 4 steps back" | Bad chunking → bad embedding → wrong top-k → confident wrong answer. The generator looks broken; the splitter is broken |
| Silent failures | No crash — just confident wrong answers | "No error, no exception" | similarity_search returns 5 documents, all irrelevant, HTTP 200, zero exceptions |
| Cost surprises | 10 iterations instead of 2 | "5x your token budget" | A retriever that returns 20 chunks instead of 5 quadruples your prompt tokens on every single request, forever |
Two of these deserve unpacking beyond the slide.
Non-determinism removes your primary lever. The source is explicit that re-asking is not a debugging technique — variation is what the model is for, so a second run tells you nothing about the first:
"That is not the point of large language models." 02:23:14
Non-determinism is a feature of the medium and simultaneously the thing that destroys the reproduce-then-fix workflow. Setting temperature=0 narrows the variance — it is why both observability files in this part, langsmith_setup.py and monitoring.py, set it — but it does not make the system deterministic end to end, because retrieval, tie-breaking, index state and provider-side routing all move underneath you.
Cost surprises are control-flow bugs wearing a billing costume. A supervisor loop that runs 10 iterations instead of 2 burns 5× the expected token budget 02:24:17. Nothing errors, nothing is slow enough to notice, and the overspend is proportional to your traffic — so the better your feature is doing, the larger the invoice that eventually surfaces it.
What observability actually is
The definition the source gives 02:24:17 is the classic control-theory one, unchanged:
"Observability is the ability to understand what your system is doing internally by looking at its outputs." 02:24:17
The LLM-specific twist is in the qualifier the slide adds: the entire journey, not just the final answer. The "outputs" you instrument are per-step records, not the response body. If the only output you can see is the thing the user sees, you are not observable — you are just reading the same paragraph the user already complained about.
Chapter 19 gives a blunter, more operational version of the same definition 04:04:43: observability is "a way in which we can look into our workflows intently and see the loggings and all of that." Same idea, plumbing-first. And it opens with the failure it exists to catch: the API calls are visibly happening, traffic is flowing, 200s are coming back — and that tells you nothing about whether the answers are correct, whether retrieval is actually retrieving, or whether the model is hallucinating. Uptime is not correctness.
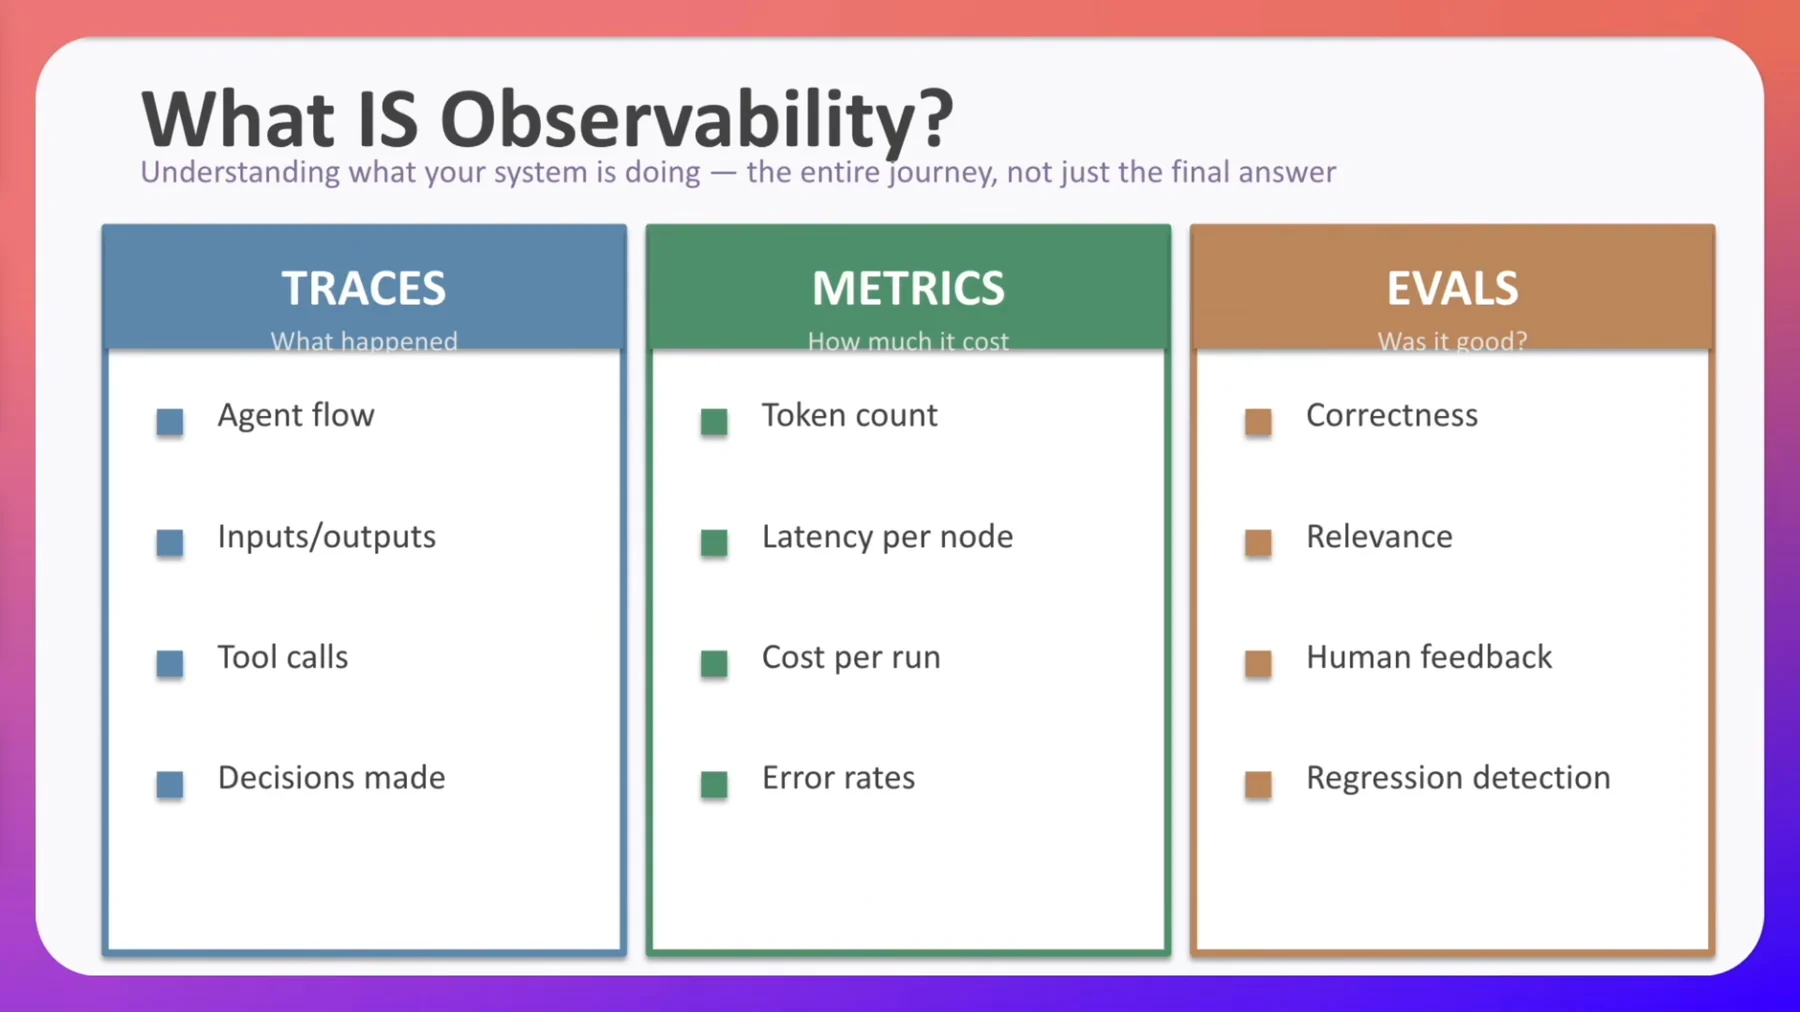
| Pillar | The question it answers | What it contains (verbatim from the slide) |
|---|---|---|
| TRACES | "What happened" | Agent flow · Inputs/outputs · Tool calls · Decisions made |
| METRICS | "How much it cost" | Token count · Latency per node · Cost per run · Error rates |
| EVALS | "Was it good?" | Correctness · Relevance · Human feedback · Regression detection |
The three pillars are not interchangeable, and the cleanest way to see that is to map them back onto the four failure reasons above:
| Failure reason | Pillar that catches it | Why the other two don't |
|---|---|---|
| Cascading errors | Traces | Metrics show the run was normal-cost; evals show the answer was bad but not where |
| Cost surprises | Metrics | Traces show a valid-looking loop; evals may even score the output well |
| Silent failures | Evals | Traces and metrics both look perfectly healthy — that is the definition of silent |
| Non-determinism | All three, over time | A single run tells you nothing; you need the distribution |
What a trace actually captures
A trace looks at "every step, every input, every output, every millisecond" of the run 02:25:18. The source walks a complete one for the multi-agent research pipeline:
- Supervisor plans 3 queries
- Search 1 → 3 findings
- Search 2 → 2 findings
- Search 3 → 3 findings
- Analyst synthesises
- Writer drafts
- Quality score = 0.6 → revision triggered
- Revised score = 0.88 → approved, run ends
That is the shape of multi_agent_research_system.py in the repo, node for node, and the correspondence is checkable rather than asserted: the file registers exactly five nodes (supervisor, search_agent, analyst, report_writer, quality_checker), its supervisor prompt asks for "exactly 3" search queries, it fans them out through LangGraph's Send API so the three searches run in parallel, and each search agent is told to return "2-3 key findings." The narrated trace is that graph executing once.
Then the source zooms into one node — "Search Agent 1" — and reads the span field by field 02:26:20:
| Span field | Value shown |
|---|---|
| Input | the search query |
| Tool | web_search was called |
| Latency | 1.2 seconds for the tool call |
| Output | 3 results with abstract |
| Tokens | input 45, output 890 |
| Cost | shown on screen, not read aloud |
Two honesty notes on that table, because the source does not flag either.
The payoff argument is short and correct 02:26:20. Once you have input, tool, latency, tokens and cost per node, you can (1) save money, (2) trust your own system, and (3) know exactly when to intervene.
"You're not flying blindly. You're actually flying with data." 02:26:20
How to read a trace when something is wrong. This is the procedure that replaces the stack trace, and it is worth memorising because it is not obvious:
- Open the top-level run (the whole graph / the whole request).
- Expand node by node in execution order.
- For each node read: input, tool called, latency, output, input tokens, output tokens, cost.
- Compare each node's output against what the next node needed.
- The first mismatch is the defect. Stop there. Do not keep walking to the node that
produced the visible symptom — with cascading errors that node is four steps downstream of the actual bug and is behaving correctly given its garbage input.
For a RAG request, step 4 has a specific shape. Here is what to look at, stage by stage — this is the RAG translation of the source's node-by-node walk, and it is the single most useful thing to internalise from this section:
| Stage | The question you ask its span | What "already wrong here" looks like |
|---|---|---|
| Query rewrite / expansion | Does the rewritten query still mean what the user asked? | "How do I cancel?" silently became "How do I delete my account?" |
| Query embedding | Is this the same model and version used at index time? | Nothing visible — this is the failure that has no symptom until recall collapses (invariant 2) |
| Vector search | What are the top-k ids and scores? | Best score is 1.34 and you are treating it as a similarity (Part 4's distance-vs-similarity trap) |
| Metadata filter | How many survived the filter? | k=5 requested and 4 come back — or zero. k is a ceiling, not a quota, and downstream code that assumes otherwise breaks |
| Fusion / rerank | Did the correct chunk move up or down? | The right chunk was at rank 7 pre-rerank and rank 9 post-rerank: your reranker is hurting you |
| Context assembly | How many tokens went into the prompt, and was anything truncated? | The answer-bearing chunk was the one that got cut |
| Generation | Is the answer supported by the context above it? | Fluent, confident, and not in the context — hallucination |
If your trace does not let you answer all seven of those questions, it is not instrumented deeply enough yet.
Why now, and not after the fire
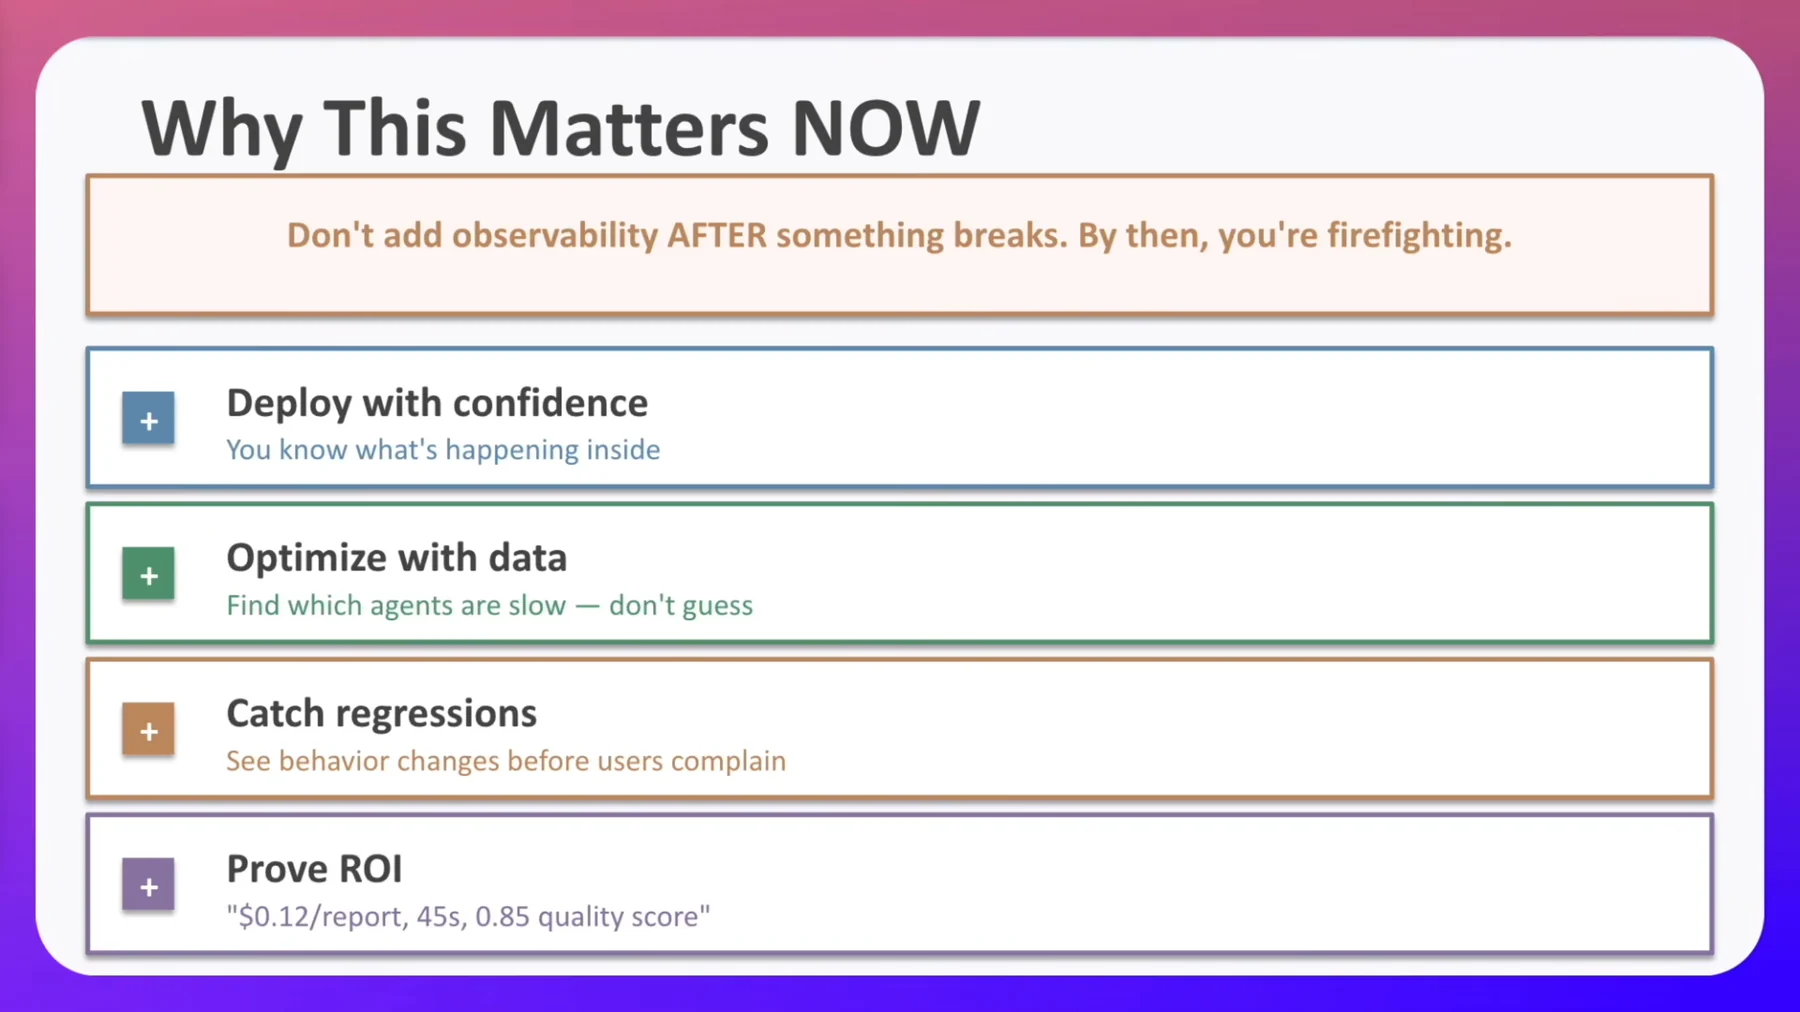
The mistake the source names 02:27:22 is that most developers think observability is something you add after something breaks. By then:
"You are firefighting. You're just putting out fires. You're not actually doing engineering." 02:27:22
The four benefits on the slide, with the numbers intact:
- Deploy with confidence — "you know what's happening inside."
- Optimize with data — "not with hopes or with thoughts." Concretely: find which stages
are slow, then remove or fix them. The slide's wording is "Find which agents are slow — don't guess."
- Catch regressions — "See behavior changes before users complain."
- Prove ROI — quote
$0.12/report, 45s, 0.85 quality scoreto your management. The
instructor is explicit about the audience: "you can give this to your managers or to your superiors."
That fourth one is under-appreciated by engineers and is the reason observability survives budget review. An LLM feature without instrumentation cannot answer "what does this cost per unit of value?" — and a feature that cannot answer that question is a feature that gets cut when the API bill lands.
The cost-surprise loop, in code
The "10 iterations instead of 2 = 5× the token budget" warning is not hypothetical, and the fix is one extra clause in the repo's own research system. This is what a bounded loop looks like:
# /home/oriol/lab/rag/code/production-course-main-code/multi_agent_research_system.py
def quality_gate(state: ResearchState) -> Literal["report_writer", "end"]:
    """Route back to writer if quality is insufficient."""
    if state["quality_score"] >= 0.7 or state["iteration"] >= 2:
        return "end"
    return "report_writer"
Two independent exit conditions: a quality threshold of 0.7 and a hard iteration cap of 2. The threshold is the one you want to fire; the cap is the one that saves you when the threshold never does. The same file belt-and-braces it inside the checker node itself:
# /home/oriol/lab/rag/code/production-course-main-code/multi_agent_research_system.py
# Force approve after 2 iterations to prevent infinite loops
approved = review.approved or state["iteration"] >= 2
That is the whole content of the cost-surprise lesson expressed as code, and it generalises directly to RAG: any self-correcting retrieval loop (retrieve → grade → rewrite → retrieve again, the agentic-RAG pattern in Part 15) needs the same second exit condition. The quality-based exit is a heuristic and heuristics fail; the counter cannot.
LangSmith: tracing with (nearly) zero code changes
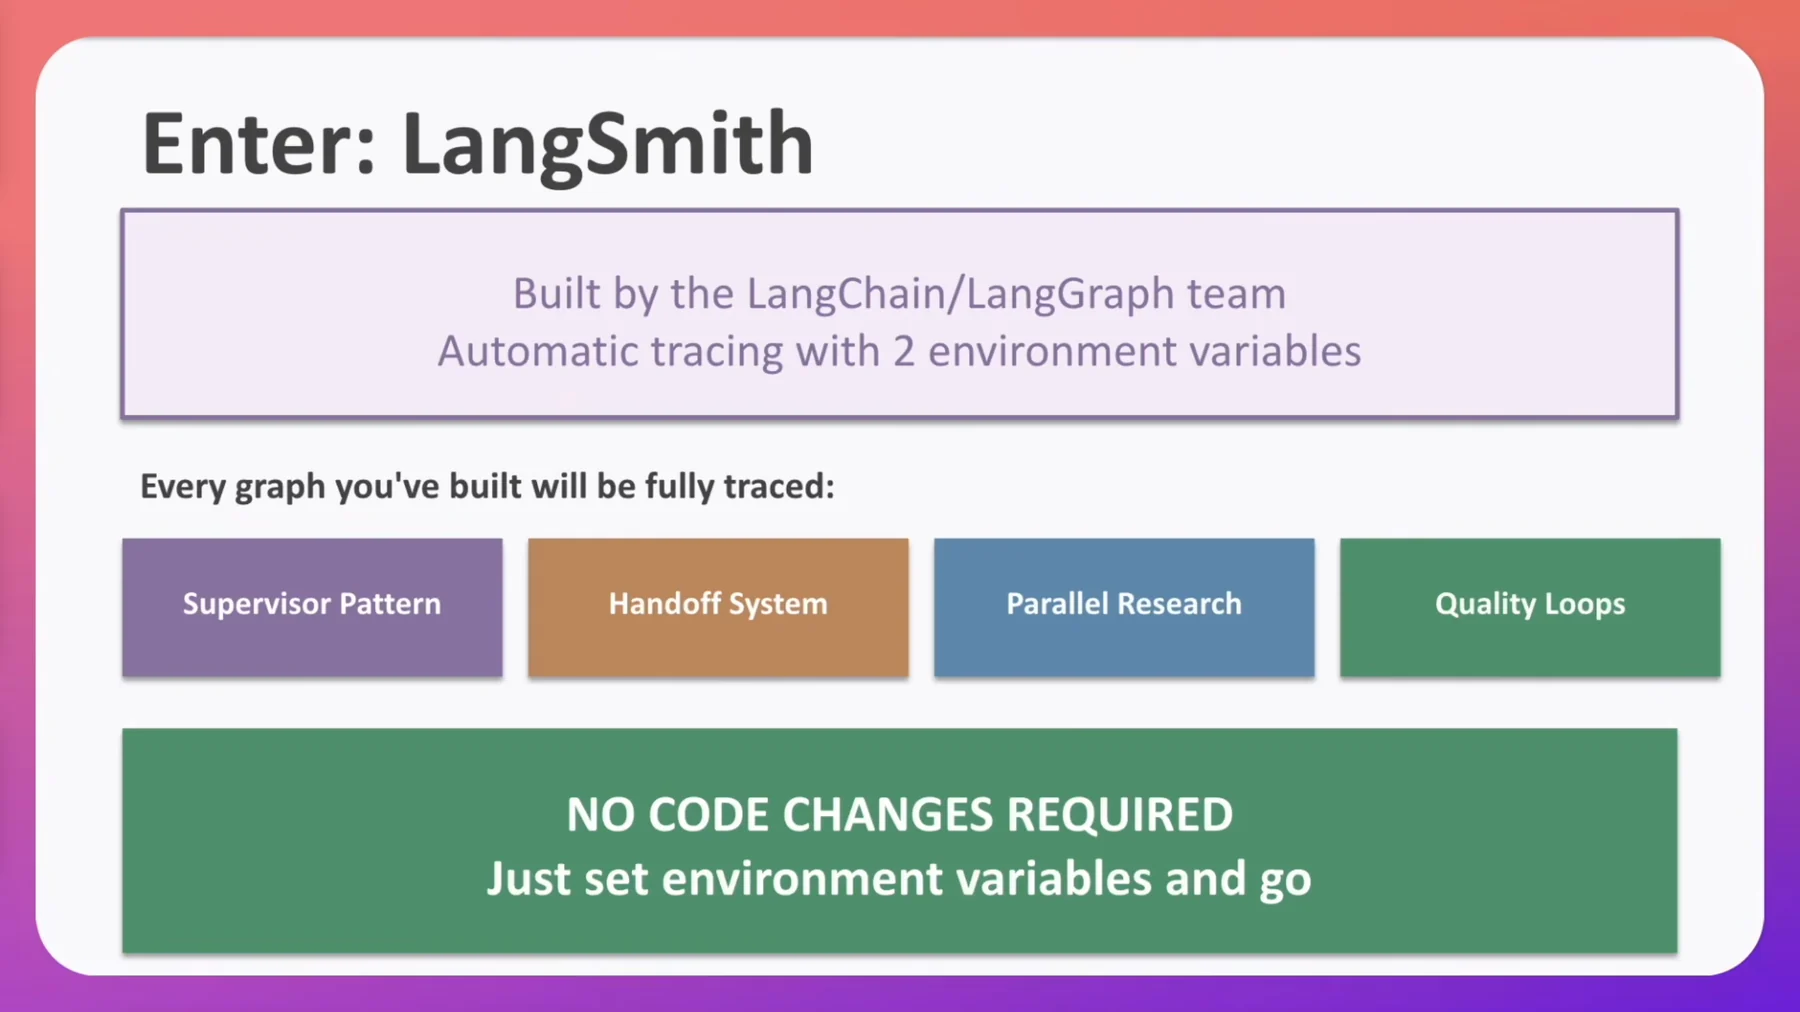
@traceable decorator. Both halves of that distinction matter when you are budgeting the work.There are many observability tools. The source picks LangSmith for three stated reasons 02:28:22: it is easier, it is built by the LangChain/LangGraph team, and it can trace whole systems from two environment variables. Chapter 13 adds the vendor's own positioning: LangSmith is "a framework agnostic platform for developing, debugging and deploying AI agents and LLM applications" 02:29:56 — you do not have to be on LangChain to use it, you just get the smoothest path if you are, and the getting-started page branches by framework so you pick the integration matching the stack you already run.
The slide sizes the win as four boxes under the header "Every graph you've built will be fully traced" — Supervisor Pattern, Handoff System, Parallel Research, Quality Loops. Read the RAG equivalent: every LCEL chain, every retriever, every LangGraph node you have already written starts emitting spans without being rewritten. That claim is real, and it is specifically a claim about framework objects, not about your own functions.
Its two headline capabilities are trace requests and evaluate outputs. The course exercises only the first. That is worth noting now rather than discovering later: evals are named as a pillar and demonstrated nowhere.
What you get the moment tracing is on, per the chapter's own summary 02:28:22–02:29:23:
- the exact prompt sent (not the template — the rendered string, with the retrieved
context interpolated into it)
- the model response
- token count and the cost it maps to
- a latency breakdown, per step
- the ability to trace through all steps of a run
The teaser walkthrough of the UI makes it concrete 02:29:23: input "what is the weather", one LLM call node that expands to show model GPT-4o, duration ~0.8 seconds, and then the output. "So now you're not blind." (Both GPT-4o and the 0.8 are reconstructions from a mangled auto-caption — the transcript reads "GPT40" and "about8 seconds" — and the repo uses gpt-4o-mini throughout, so treat the exact model suffix as unconfirmed.)
Getting an account and a key 02:29:56–02:30:59:
- Go to
smith.langchain.com. No credit card is required. - Sign in with GitHub, email or Google.
- Expect an empty dashboard. *"In your case you probably won't see much really if this is
your first time — that's totally fine."* An empty Tracing view is not a broken setup.
- Go to Settings → API keys (not the project view).
- Create a personal access key in your personal default workspace. That is sufficient;
you do not need service- or organisation-scoped keys for this.
- A description is mandatory — the form blocks you until you type one. The instructor
uses "My testing playground".
- Copy the key immediately. It is displayed once. You cannot retrieve it later, only mint
a new one — and keys are unlimited ("you can always come back here and create as many as you need"), so mint one per machine or project rather than reusing one everywhere. The instructor says you "should get, I believe, two" values at creation; he is visibly hedging and the modern dialog surfaces one key plus workspace context — do not treat "two keys" as a fact, just save everything the dialog shows you.
Install and configure:
uv add langsmith
One accuracy note if you go looking: the shipped pyproject.toml never gains a langsmith line — the package arrives transitively through langchain-core, and uv.lock pins it at 0.6.6 on Python ≥3.12. Running uv add langsmith anyway is the right move, because it makes a dependency you now import directly (from langsmith import traceable) an explicit one instead of leaving it at the mercy of a LangChain upgrade.
# .env — never commit this file
OPENAI_API_KEY=sk-...
ANTHROPIC_API_KEY=sk-ant-...        # unused here; harmless to keep
LANGSMITH_API_KEY=lsv2_pt_...
LANGSMITH_TRACING=false             # the source ships false and overrides it in code
                                    # — set it to true here and delete the override
LANGSMITH_PROJECT=multi-agent research
| Variable | Required? | What it does |
|---|---|---|
LANGSMITH_API_KEY | Yes | Authenticates the SDK against your workspace |
LANGSMITH_TRACING | Yes | The master on/off switch. "true" enables global tracing; anything else and decorated functions still run but emit nothing |
LANGSMITH_PROJECT | Optional | The bucket traces are written into. Strongly recommended — without it everything lands in one undifferentiated pile |
The repo's .gitignore opens with the right comment for exactly this reason: # Environment variables — NEVER commit these.
@traceable — the whole instrumentation API
The single most important takeaway of the hands-on chapter is that instrumentation is one decorator on an ordinary function 02:33:02.
"Notice all of these are just functions. It's just that we then append
@traceable." 02:33:02
Here is the enabling line and the first demo, verbatim from the repo:
# /home/oriol/lab/rag/code/production-course-main-code/langsmith_setup.py
import os
from langchain_openai import ChatOpenAI
from langchain_core.prompts import ChatPromptTemplate
from langchain_core.output_parsers import StrOutputParser
from langsmith import traceable
from langsmith.run_trees import RunTree
from dotenv import load_dotenv

load_dotenv()

# Enable tracing
os.environ["LANGSMITH_TRACING"] = "true"


@traceable(name="basic_chaining")
def demo_basic_tracing():
    """Basic LangSmith tracing."""

    llm = ChatOpenAI(model="gpt-4o-mini", temperature=0)

    prompt = ChatPromptTemplate.from_template("Explain {topic} in one sentence.")

    chain = prompt | llm | StrOutputParser()

    print("Basic Tracing Demo:\n")
    print("Running chain with LangSmith tracing enabled...")

    result = chain.invoke({"topic": "machine learning"})

    print(f"Result: {result}")
    print("\nCheck LangSmith dashboard for trace details.")
Three properties of that decorator are doing all the work:
- It works on plain Python functions, not just LangChain runnables. You can instrument
arbitrary business logic — your chunker, your reranker wrapper, your citation formatter.
- Nesting is automatic. Once the outer function is traceable, the prompt, the LLM call and
the output parser inside it are picked up as child runs. You do not decorate the inner calls yourself. (The instructor calls the thing doing the capture "LangGraph" at 02:33:02; it is the LangSmith SDK. Don't propagate the slip.)
name=gives the run a readable identity. Without it you get the raw Python function
name. Named runs are how you find anything later.
One dead detail worth knowing so you don't chase it: RunTree is imported and never used in the shipped file. It is not part of the lesson.
The teaching ladder is three functions at three levels of instrumentation:
| Level | Decorator | What you gain |
|---|---|---|
| 1 | @traceable(name="basic_chaining") | A named run in the dashboard |
| 2 | @traceable(name="named_runs_demo", tags=["production", "summarization"]) | Filterable by environment and workload type |
| 3 | @traceable(name="trace_with_metadata_demo", tags=["metadata", "filtering"]) on a function taking user_id / request_type | Per-user, per-request-type attribution — the arguments become trace metadata automatically |
Level 3 is the one that matters in production, and its mechanism is delightfully cheap: the way you get user attribution into LangSmith is simply to pass those values as arguments to the traced function. The demo makes the point almost too well — request_type is declared, never referenced in the body, and exists purely so that it appears on the run. That is the pattern: an argument you never use is still a filter you can slice the dashboard by.
The flip side is a privacy constraint you should decide on deliberately. If arguments become trace metadata automatically, then whatever you pass to a traced function leaves your process and lands in a vendor's store — including the user's raw question and, in a RAG system, the retrieved chunks. Pass an opaque user_id, not an email; apply your PII masking (Part 12) before the traced boundary, not after it.
# /home/oriol/lab/rag/code/production-course-main-code/langsmith_setup.py
@traceable(name="trace_with_metadata_demo", tags=["metadata", "filtering"])
def demo_trace_with_metadata(user_id: str, request_type: str):
    """Add metadata to traces for filtering."""

    llm = ChatOpenAI(model="gpt-4o-mini", temperature=0)

    # Metadata is automatically captured
    result = llm.invoke(f"Hello from user {user_id}")

    return result.content
The full langsmith_setup.py, all 74 lines
"""
LangSmith Setup and Observability
Production monitoring for LangChain/LangGraph
"""

import os
from langchain_openai import ChatOpenAI
from langchain_core.prompts import ChatPromptTemplate
from langchain_core.output_parsers import StrOutputParser
from langsmith import traceable
from langsmith.run_trees import RunTree
from dotenv import load_dotenv

load_dotenv()

# Enable tracing
os.environ["LANGSMITH_TRACING"] = "true"


@traceable(name="basic_chaining")
def demo_basic_tracing():
    """Basic LangSmith tracing."""

    llm = ChatOpenAI(model="gpt-4o-mini", temperature=0)

    prompt = ChatPromptTemplate.from_template("Explain {topic} in one sentence.")

    chain = prompt | llm | StrOutputParser()

    print("Basic Tracing Demo:\n")
    print("Running chain with LangSmith tracing enabled...")

    result = chain.invoke({"topic": "machine learning"})

    print(f"Result: {result}")
    print("\nCheck LangSmith dashboard for trace details.")


@traceable(name="named_runs_demo", tags=["production", "summarization"])
def demo_named_runs():
    """Name your runs for easier identification."""

    llm = ChatOpenAI(model="gpt-4o-mini", temperature=0)

    prompt = ChatPromptTemplate.from_template("Summarize: {text}")

    chain = prompt | llm | StrOutputParser()

    print("\nNamed Runs Demo:\n")

    result = chain.invoke(
        {"text": "LangSmith provides observability for LLM applications."}
    )

    print(f"Result: {result}")
    print("Run tagged with 'production', 'summarization'")


@traceable(name="trace_with_metadata_demo", tags=["metadata", "filtering"])
def demo_trace_with_metadata(user_id: str, request_type: str):
    """Add metadata to traces for filtering."""

    llm = ChatOpenAI(model="gpt-4o-mini", temperature=0)

    # Metadata is automatically captured
    result = llm.invoke(f"Hello from user {user_id}")

    return result.content


if __name__ == "__main__":
    demo_basic_tracing()
    demo_named_runs()
    demo_trace_with_metadata(user_id="user_123", request_type="greeting")
Reading the dashboard
Run the three demos and the project shows trace count = 3 with columns for latency, total tokens and cost 02:34:02. Clicking into the metadata run gives the full record 02:35:02:
| Field | Value in the demo |
|---|---|
| Run name | trace_with_metadata_demo |
| Metadata | user_id: user_123, request_type: greeting |
| Input / Output | the prompt in, "hello user how can I assist you today" out |
| Status | success |
| Total tokens | 26, hover for the split: 20% input / 80% output |
| Latency | 1.15 s |
| Type | chain — "the type is chain because we're using chains" |
| Tags | metadata, filtering |
Inside that parent run there is a child span for the model invocation showing the literal human input and ai output. That is the "see the exact prompt sent, see the exact model response" promise made concrete — and in a RAG system it is the single most valuable view you have, because it is the only place you can read the fully-assembled context the model actually saw, as opposed to the context you believe your code assembled.
Run type is inferred, and you should care which one you get. The instructor's explanation is one sentence — "the type is chain because we're using chains" 02:35:02 — but the classification is load-bearing when you start filtering. LangSmith buckets runs by kind: an LCEL pipeline registers as chain, a model call as llm, and a retriever as retriever. That last one is the reason a RAG service benefits from wrapping retrieval in a LangChain retriever object rather than a bare function: you get a first-class run type you can filter and aggregate on, instead of an anonymous chain span you have to recognise by name. Every run also carries its start and end timestamps alongside cost and tags, so ordering questions ("did the rerank happen before or after the filter?") are answerable from the trace alone.
Three dashboard gotchas from the same walkthrough:
- A traced function that returns
Nonelogsoutput: null. Two of the three demos only
print; their traces show empty input and null output 02:36:04 and look broken but aren't. @traceable records arguments in and return value out. If you want a useful trace, take arguments and return a value — that is a design constraint on your instrumented functions, not a UI quirk.
- The UI is not live — refresh it. Fields that looked empty populated after a browser
refresh 02:36:04. Do not start debugging your instrumentation over this.
- The second run reports latency
135with no unit spoken; almost certainly 135 ms,
given the sibling run was 1.15 s. Flagged as a reconstruction.
LangSmith has more surface than tracing — the source points at Monitoring (dashboards), Automations, Evaluators and Threads without teaching any of them 02:37:05, and notes honestly that the Monitoring tab shows essentially nothing when you have three traces. Three traces is not a monitoring dataset. Don't judge the feature on a toy run.
Three pillars of production visibility
Everything so far has been a hosted tool doing the work. The rest of this part is what you build yourself, in your own process — and it exists because a hosted trace store is not a log aggregator and not a metrics backend.
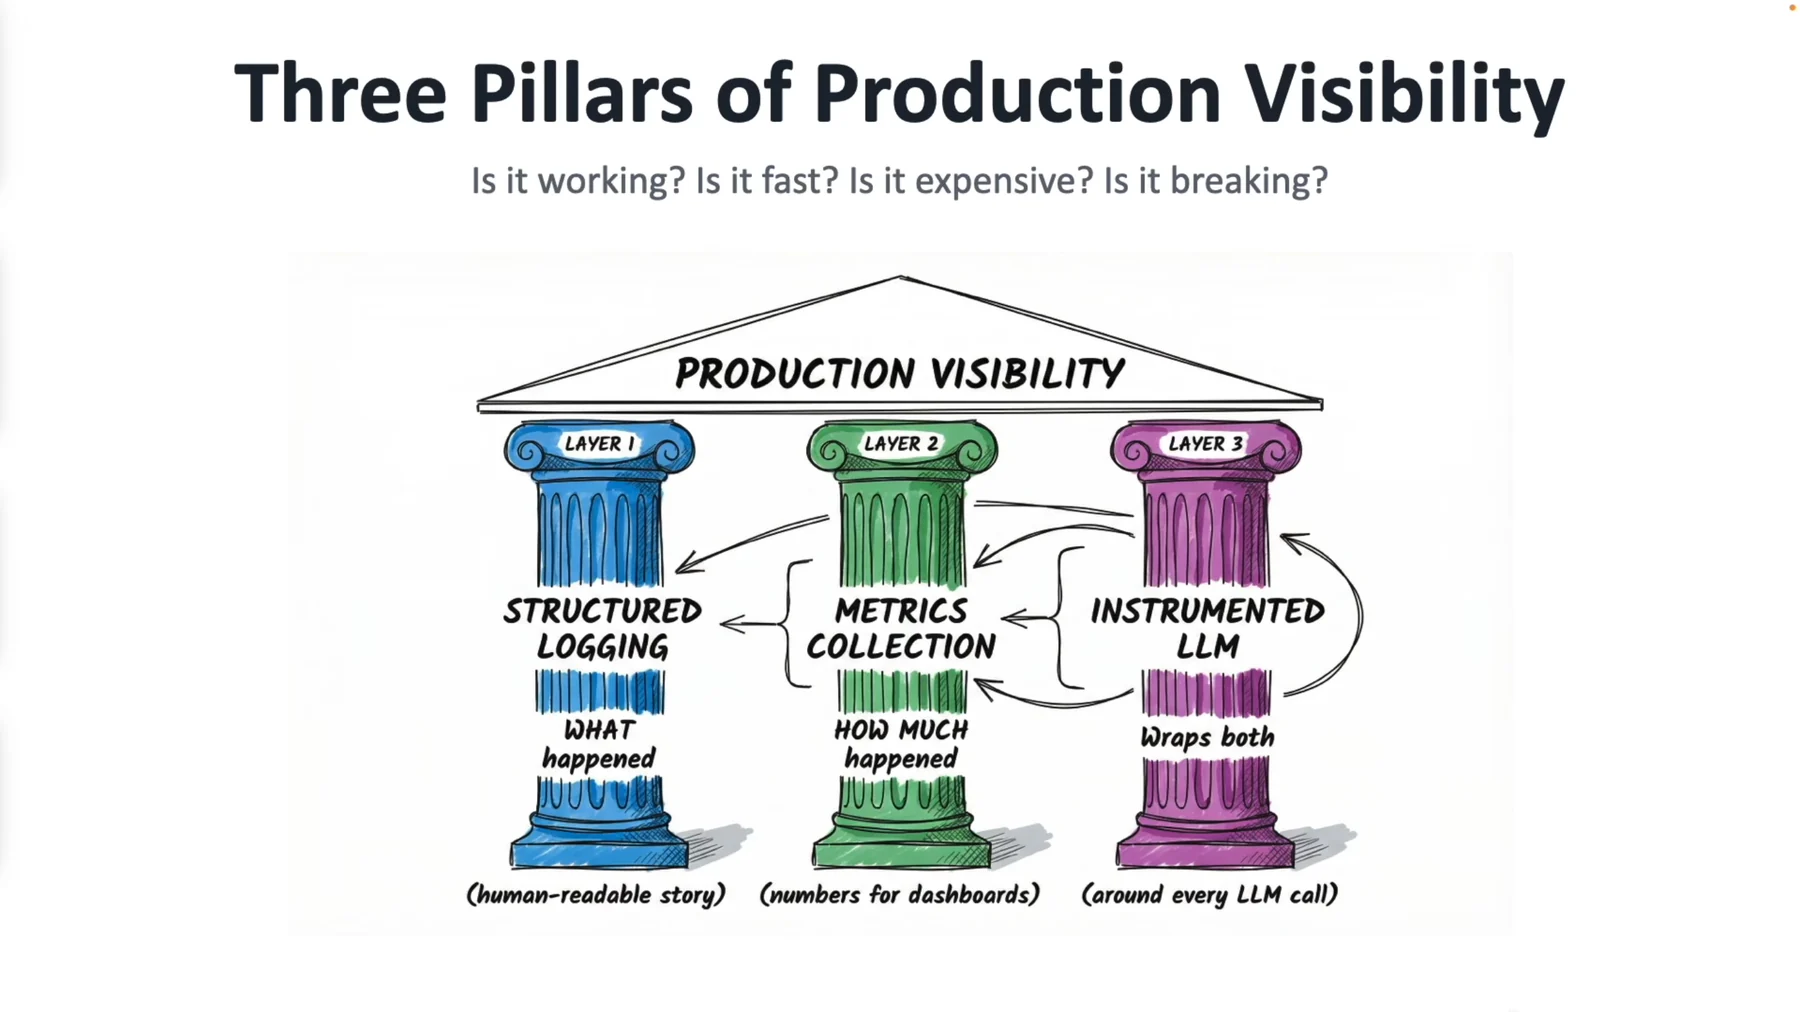
The subtitle is the best four-question summary of production visibility in the whole source:
"Is it working? Is it fast? Is it expensive? Is it breaking?" 04:04:43
| Question | Answered by | Concretely |
|---|---|---|
| Is it working? | Structured logging + traces | A per-request JSON line and a per-stage span |
| Is it fast? | Latency metrics | latency_sum / latency_count |
| Is it expensive? | Token counters + cache-hit rate | tokens_input, tokens_output, cache_hits |
| Is it breaking? | Error counters | errors_total / requests_total |
And the three layers themselves:
| Layer | Name | Answers | Slide caption |
|---|---|---|---|
| 1 | Structured logging | WHAT happened | (human-readable story) |
| 2 | Metrics collection | HOW MUCH happened | (numbers for dashboards) |
| 3 | Instrumented LLM | wraps both | (around every LLM call) |
"…is what will allow us to answer this and see in reality, not just imagine hoping that things are actually working internally." 04:04:43
Where monitoring sits: the layer hierarchy
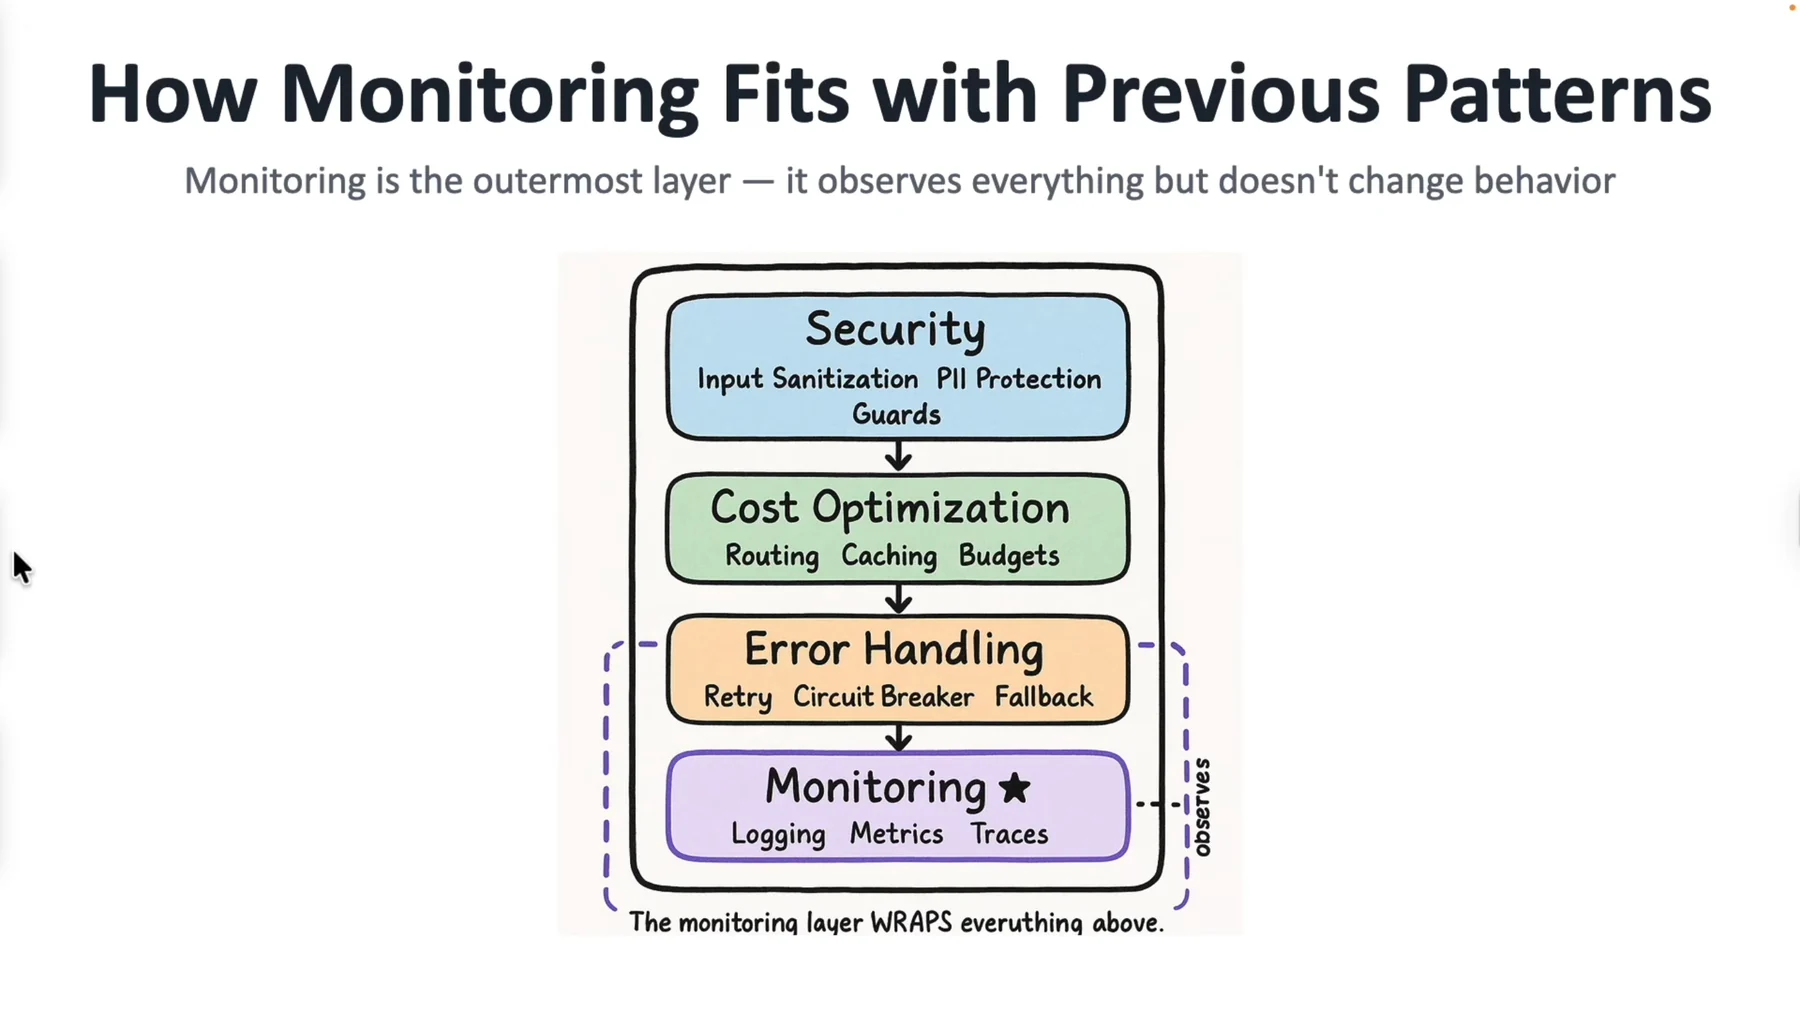
| Order | Layer | Sub-techniques on the slide | Changes behaviour? |
|---|---|---|---|
| 1 (first to run) | Security | Input Sanitization · PII Protection · Guards | Yes — blocks or rewrites input |
| 2 | Cost Optimization | Routing · Caching · Budgets | Yes — reroutes to a cheaper model, serves from cache |
| 3 | Error Handling | Retry · Circuit Breaker · Fallback | Yes — retries, trips, falls back |
| 4 (outermost) | Monitoring ★ | Logging · Metrics · Traces | No — and this is the point |
The slide states it twice — once as its subtitle, once as the caption under the drawing — and it is invariant 6 of this guide:
"Monitoring is the outermost layer — it observes everything but doesn't change behavior." 04:06:43
"The monitoring layer WRAPS everything above." 04:06:43
That is the distinguishing property. The other three layers all do something: they block, reroute, retry, fall back. Monitoring is the only one whose correctness criterion is that removing it changes nothing about what the system returns. The source is unambiguous that the ordering is not optional 04:07:44: "for production LLM applications, you must have this hierarchy — security at the top, cost optimization, error handling, and most importantly, monitoring."
This is the same picture as the production request pipeline from Part 1 — Client → Rate limiter → Security → Cache → Model (+retry +fallback) → Output validation → Metrics/logging → JSON response — with the layers named rather than sequenced. Cheap rejections first, expensive inference last, and a recorder wrapped around the whole thing.
Pillar 1 — structured logging
The objection is pre-empted honestly 04:07:44: "we can just use regular logs, right?" The answer is a scale argument, not a purity argument, and it is the best line in the chapter:
"It's okay to use logs when you're reading logs in your terminal. And it's totally useless when you have 10,000 requests per hour." 04:07:44
Three concrete queries that plain text logs cannot answer:
- *Show me all requests over 1 second.*
- Show me all errors from the billing agent. (filter by module/component)
- Show me all requests from a specific user. (filter by user id)
Structured logging is emitting each log line as a JSON object with typed fields instead of a prose sentence, so a log aggregator can index and query the fields. Datadog, Elasticsearch and CloudWatch all ingest this directly 04:09:48. The two example queries it unlocks are "show me all logs where latency_ms was greater than 1,000" and "count errors by module" — both trivial against JSON fields and, as the source puts it, impossible against plain text 04:09:48. The distinction is not cosmetic: a prose sentence records that something happened, a JSON object records what the values were, and only the second can be counted.
"So every log line is a JSON object." 04:09:48
The whole of this pillar and the next two live in one 212-line file. Its imports tell you what it is made of — stdlib plus two LangChain pieces plus the LangSmith decorator:
# /home/oriol/lab/rag/code/production-course-main-code/monitoring.py
import logging
import json
import time
from datetime import datetime, timezone
from functools import wraps
from typing import Any, Callable
from langchain_openai import ChatOpenAI
from langchain_core.callbacks import BaseCallbackHandler
from langchain_core.messages import HumanMessage
from langsmith import traceable
from dotenv import load_dotenv

load_dotenv()
wraps, Any, Callable, HumanMessage and BaseCallbackHandler are imported and never used. The last of those is the interesting one, because it names the route this file does not take: LangChain exposes a callback interface (BaseCallbackHandler, with on_llm_start / on_llm_end / on_llm_error hooks) that lets you attach instrumentation to every model call in a chain without wrapping the model in a class of your own. The wrapper approach shown here is simpler to read and gives you an explicit call site; the callback approach composes better when the LLM is buried three layers deep inside an LCEL chain you did not write. Know that both exist.
Here is the entire implementation of pillar 1. It is one logging.Formatter subclass overriding one method:
# /home/oriol/lab/rag/code/production-course-main-code/monitoring.py
class JSONFormatter(logging.Formatter):
    """Format logs as JSON for log aggregation."""

    def format(self, record):
        log_obj = {
            "timestamp": datetime.now(timezone.utc).isoformat(),
            "level": record.levelname,
            "message": record.getMessage(),
            "module": record.module,
            "function": record.funcName,
        }

        if hasattr(record, "extra_data"):
            log_obj.update(record.extra_data)

        return json.dumps(log_obj)


def setup_logging():
    """Setup structured JSON logging."""

    logger = logging.getLogger("langgraph_app")
    logger.setLevel(logging.INFO)

    handler = logging.StreamHandler()
    handler.setFormatter(JSONFormatter())
    logger.addHandler(handler)

    return logger
The instructor's verdict — "very simple but useful" 04:08:46 — is fair. Five base fields on every line, and one escape hatch. Two configuration choices in setup_logging() are worth reading deliberately. The logger is named ("langgraph_app") rather than the root logger, which is correct: JSON-formatting the root logger would rewrite every line every third-party library emits. And the handler is a bare StreamHandler at level INFO — which writes to stderr, because that is StreamHandler's default when you pass it no stream. If your deployment expects application logs on stdout (most container log drivers treat stderr as the error channel and may tag every line as an error), that is a one-argument fix you should make before you ship: logging.StreamHandler(sys.stdout).
| Field | Source |
|---|---|
timestamp | datetime.now(timezone.utc).isoformat() — ISO-8601, UTC, timezone-aware |
level | record.levelname |
message | record.getMessage() |
module | record.module |
function | record.funcName |
The extra_data escape hatch is the mechanism that makes the whole thing useful. Callers pass extra={"extra_data": {...}} to logger.info(...), and those keys get merged into the top level of the JSON object — which is how latency_ms, input_tokens and output_tokens end up as first-class queryable fields rather than being interpolated into a sentence.
The smoke test (shipped commented-out at the bottom of the file):
# /home/oriol/lab/rag/code/production-course-main-code/monitoring.py  (lines 210-211)
logger = setup_logging()
logger.info("Logging setup complete", extra={"extra_data": {"app": "langgraph"}})
produces a line carrying timestamp, level: INFO, message: "Logging setup complete", module: monitoring, function: <module> and app: langgraph. That <module> is an incidental but instructive detail: funcName is real and dynamic, and it reads <module> here only because the call happens at module scope. In the live demo the same field reads invoke.
Pillar 2 — metrics collection
The clearest contrast in the source 04:10:48:
- A log is an individual event: *"request X took 453 milliseconds."*
- A metric is an aggregate: *"the average latency was 320 milliseconds."*
"Logs and metrics are different things but together they tell a better story." 04:10:48
You need both because they answer different questions. The log tells you about that request — which user, which query, which document ids. The metric tells you about the population — is today worse than yesterday. Neither substitutes for the other, and a system with only metrics can tell you that something got slower without ever telling you which request to look at.
The eight counters. The instructor counts them out loud on air and frames them as "all you need to understand the health of your LLM application" — while adding "and as many as we want to add." Read that as a floor, not a ceiling.
# /home/oriol/lab/rag/code/production-course-main-code/monitoring.py
class MetricsCollector:
    """Collect and aggregate metrics."""

    def __init__(self):
        self.metrics = {
            "requests_total": 0,
            "errors_total": 0,
            "latency_sum": 0,
            "latency_count": 0,
            "tokens_input": 0,
            "tokens_output": 0,
            "cache_hits": 0,
            "cache_misses": 0,
        }

    def record_request(
        self,
        latency_ms: float,
        input_tokens: int,
        output_tokens: int,
        error: bool = False,
        cache_hit: bool = False,
    ):
        self.metrics["requests_total"] += 1
        self.metrics["latency_sum"] += latency_ms
        self.metrics["latency_count"] += 1
        self.metrics["tokens_input"] += input_tokens
        self.metrics["tokens_output"] += output_tokens

        if error:
            self.metrics["errors_total"] += 1

        if cache_hit:
            self.metrics["cache_hits"] += 1
        else:
            self.metrics["cache_misses"] += 1
| # | Counter | Meaning |
|---|---|---|
| 1 | requests_total | how many calls |
| 2 | errors_total | how many failed |
| 3 | latency_sum | running sum of milliseconds |
| 4 | latency_count | running count of measurements |
| 5 | tokens_input | cumulative prompt tokens |
| 6 | tokens_output | cumulative completion tokens |
| 7 | cache_hits | cumulative hits |
| 8 | cache_misses | cumulative misses |
Five things per LLM call, one method 04:11:49: how long it took, how many tokens in, how many tokens out, did it fail, was it cached.
"So one method call captures everything." 04:11:49
That is a design rule worth stating explicitly: do not scatter five counter increments across your codebase. Funnel them into a single record_request, so that adding a ninth metric is one edit rather than an archaeology exercise. Note also that cache_hits and cache_misses are mutually exclusive and unconditional, so hits + misses always equals requests — a free invariant you can assert on in tests.
Two limits of this class that the source does not state, and that you will hit the day you put it behind a web server. self.metrics[k] += 1 is a read-modify-write, not an atomic operation, so under a threaded server concurrent requests will occasionally lose an increment; and the counters live in a plain dict, so they reset on every restart and cannot be summed across replicas. Neither matters for a demo. Both matter the moment the number is used to make a decision, which is why the production answer is a real metrics client — Prometheus counters, or your platform's equivalent — with record_request kept as the single call site in front of it.
get_summary() is where the derivation happens, with a guard on every division so a cold collector returns 0 instead of raising ZeroDivisionError:
# /home/oriol/lab/rag/code/production-course-main-code/monitoring.py
    def get_summary(self) -> dict:
        avg_latency = (
            self.metrics["latency_sum"] / self.metrics["latency_count"]
            if self.metrics["latency_count"] > 0
            else 0
        )
        error_rate = (
            self.metrics["errors_total"] / self.metrics["requests_total"]
            if self.metrics["requests_total"] > 0
            else 0
        )
        cache_hit_rate = (
            self.metrics["cache_hits"]
            / (self.metrics["cache_hits"] + self.metrics["cache_misses"])
            if (self.metrics["cache_hits"] + self.metrics["cache_misses"]) > 0
            else 0
        )

        return {
            "total_requests": self.metrics["requests_total"],
            "total_errors": self.metrics["errors_total"],
            "error_rate": f"{error_rate:.2%}",
            "avg_latency_ms": round(avg_latency, 2),
            "total_input_tokens": self.metrics["tokens_input"],
            "total_output_tokens": self.metrics["tokens_output"],
            "cache_hit_rate": f"{cache_hit_rate:.2%}",
        }
| Summary key | Formatting |
|---|---|
total_requests | int |
total_errors | int |
error_rate | f"{error_rate:.2%}" — percentage string, 2 decimals |
avg_latency_ms | round(avg_latency, 2) — float, 2 decimals |
total_input_tokens | int |
total_output_tokens | int |
cache_hit_rate | f"{cache_hit_rate:.2%}" — percentage string, 2 decimals |
Note the deliberate rename between storage and presentation: requests_total becomes total_requests. Internal counter names and external report shape are allowed to differ, and keeping them distinct means you can change one without breaking the other.
Pillar 3 — the instrumented LLM
Layer 3 is the wrapper that makes layers 1 and 2 automatic. One invoke, three signals: a metrics row, a JSON log line, and a LangSmith span.
# /home/oriol/lab/rag/code/production-course-main-code/monitoring.py
class InstrumentedLLM:
    """LLM with full instrumentation."""

    def __init__(self):
        self.llm = ChatOpenAI(model="gpt-4o-mini", temperature=0)
        self.metrics = MetricsCollector()
        self.logger = setup_logging()

    @traceable(name="instrumented_invoke")
    def invoke(self, query: str) -> str:
        start_time = time.time()
        error = False

        try:
            response = self.llm.invoke(query)
            result = response.content

            # Estimate tokens
            input_tokens = len(query.split()) * 4 // 3
            output_tokens = len(result.split()) * 4 // 3

            self.metrics.record_request(
                latency_ms=(time.time() - start_time) * 1000,
                input_tokens=input_tokens,
                output_tokens=output_tokens,
                error=False,
                cache_hit=False,
            )

            self.logger.info(
                "LLM request completed",
                extra={
                    "extra_data": {
                        "latency_ms": (time.time() - start_time) * 1000,
                        "input_tokens": input_tokens,
                        "output_tokens": output_tokens,
                    }
                },
            )

            return result

        except Exception as e:
            error = True
            self.metrics.record_request(
                latency_ms=(time.time() - start_time) * 1000,
                input_tokens=0,
                output_tokens=0,
                error=True,
                cache_hit=False,
            )

            self.logger.error(
                f"LLM request failed: {e}", extra={"extra_data": {"error": str(e)}}
            )

            raise
Read the failure path carefully, because it is invariant 6 expressed in twelve lines:
- Latency is still recorded on failure. A timeout's latency is real data — arguably the
most interesting latency you have. Dropping it biases your average downward exactly when things are going wrong.
- Tokens are recorded as 0 on failure, which is honest but means
tokens_inputunder-counts
real spend if the provider billed you for a request that then failed downstream.
raisere-raises. Monitoring observes; it does not swallow. Areturn Nonehere
would convert a loud failure into a silent one — the exact disease this part exists to treat.
The token estimation heuristic and why you must replace it.
# /home/oriol/lab/rag/code/production-course-main-code/monitoring.py  (lines 145-146)
            # Estimate tokens
            input_tokens = len(query.split()) * 4 // 3
            output_tokens = len(result.split()) * 4 // 3
words × 4 ÷ 3 ≈ 1.333 tokens per word, integer-floored. It is a demo convenience, not billing truth. It will drift badly on code, on non-English text, on long words, on anything with heavy punctuation, and — critically for RAG — on retrieved context, which is exactly the part of your prompt that dominates your bill. The source does not flag this; it should be flagged.
The correction is to read the real usage the provider returns rather than guessing from the string. LangChain surfaces it on the response message. This is not in the shipped file — it is the patch you should apply — so verify the exact shape against your provider and LangChain version before trusting the numbers:
# Suggested replacement for the estimate — NOT in the shipped monitoring.py.
# ChatOpenAI returns an AIMessage carrying provider usage; prefer it over a word-count guess.
response = self.llm.invoke(query)
result = response.content

usage = getattr(response, "usage_metadata", None) or {}
input_tokens = usage.get("input_tokens")
output_tokens = usage.get("output_tokens")

if input_tokens is None or output_tokens is None:      # provider didn't report usage
    input_tokens = len(query.split()) * 4 // 3         # fall back to the estimate
    output_tokens = len(result.split()) * 4 // 3
Three small code smells in the shipped file, named so you don't copy them:
time.time() - start_timeis computed twice in the happy path (once for metrics, once
for the log), so the two numbers differ by a few microseconds. Compute it once into a local.
- The local
errorvariable is assigned in both branches and never read. Dead code. cache_hit=Falseis hard-coded in both branches, which is why the demo always reports a
0% cache hit rate. The field exists so you can wire in the semantic cache from the caching part of this guide; the plumbing is simply not connected yet.
The demo run, and what its numbers actually tell you
# /home/oriol/lab/rag/code/production-course-main-code/monitoring.py
def demo_monitoring():
    """Demonstrate monitoring."""

    llm = InstrumentedLLM()

    print("Monitoring Demo:\n")

    queries = [
        "What is Python?",
        "Explain machine learning.",
        "What is 2 + 2?",
    ]

    for query in queries:
        result = llm.invoke(query)
        print(f"Query: {query[:30]}... -> {result[:30]}...")

    print("\nMetrics Summary:")
    summary = llm.metrics.get_summary()
    for key, value in summary.items():
        print(f"  {key}: {value}")
Per request you get one JSON line carrying timestamp, level, message: "LLM request completed", module: monitoring, function: invoke, plus the three extra_data fields latency_ms, input_tokens, output_tokens 04:13:53.
And at the end, the aggregate 04:14:54:
| Metric | Demo value |
|---|---|
| total requests | 3 |
| total errors | 0 |
| error rate | 0% |
| avg latency | ≈8,000 ms |
| total input tokens | 14 |
| total output tokens | 876 |
| cache hit rate | 0% |
Meanwhile LangSmith shows 3 runs named instrumented_invoke, one per query, in the project the instructor calls "multi-agent" (Chapter 13 named it multi-agent research; the discrepancy is his, not yours — pick one name and keep it), with latency visible directly in the run list. One run took 17 seconds — "Explain machine learning.", because it generated a long answer.
Now read that table the way you would read a real dashboard, because it is a small masterclass in why raw numbers need interpretation:
- Error rate 0% means nothing here. Three successful requests. This is the exact statistic
that stays green while your answers are garbage.
- 8,000 ms average latency is alarming and is an artefact of n=3. Do the arithmetic: one
17-second run plus two of roughly 3.5 s sums to about 24 s, and 24 / 3 = 8. The mean is describing a request that never happened. This is the "you can't average averages" lesson's twin — you also can't trust a mean with no distribution behind it — and a p50 of ~3.5 s would have told a completely different, and more honest, story.
- 14 input tokens across three short queries is exactly what the
words × 4 // 3heuristic
predicts: 3 words → 4, 3 words → 4, 5 words → 6. Which is also the proof that it is a word counter and not a tokenizer. It cannot see the chat-template overhead — role markers and message delimiters — that the provider bills on every single call regardless of how short your string is, so it under-counts by a fixed amount per request, forever.
- Cache hit rate 0% is hard-coded, not measured.
LangSmith is not your log aggregator
This is the chapter's closing warning 04:15:57 and the most important operational point in this part.
"These are two separate systems — complementary data." 04:15:57
| LangSmith | Datadog / CloudWatch / Elasticsearch | |
|---|---|---|
| Receives | Traces / spans | Structured JSON log lines |
| From | (a) the @traceable decorator and (b) LangChain's built-in instrumentation | your StreamHandler writing JSONFormatter output to the process's standard streams |
| Good at | Per-run causal structure: nested spans, prompts, completions, token/cost per node | Fleet-wide search and aggregation, alerting, retention, correlation with non-LLM services |
| Bad at | Being your system-of-record for everything else your service does | Reconstructing the shape of a nested LLM call graph |
Two trace sources, one trace destination; one log source, a different log destination. Shipping one does not give you the other. The practical implication for a production RAG service is that you run both: LangSmith for "why was this answer wrong," your aggregator for "how many requests from tenant X exceeded 1 second last Tuesday."
Evals: the pillar the source never demonstrates
Say this plainly, because it is the largest hole in the source material. Evals are named as one of the three pillars and are demonstrated nowhere. Chapter 12 defines them (correctness, relevance, human feedback, regression detection). Chapter 13 gestures at LangSmith's Evaluators tab for one sentence and moves on 02:37:05. Chapter 19 does not mention them at all. Every number the source gives you about evals — including the ROI slide's 0.85 quality score — comes from a quality-checker node inside a demo graph, not from an evaluation harness.
That matters because evals are the only pillar that catches the failure mode this whole part opened with. Traces show you a healthy-looking run. Metrics show you a healthy-looking cost and latency. Silent failures are invisible to both by construction. A system with traces and metrics but no evals is a system that will confidently tell you it is fine while returning wrong answers — which is the exact condition described at 04:04:43: the API calls are happening, and you still don't know if it's working.
What you actually need, stated as requirements rather than pretending the source covered it:
- A golden set. Fifty to a few hundred (question, expected-answer, expected-source-chunk)
triples drawn from your real corpus and your real users' questions. This is the expensive part and there is no way around it.
- Retrieval metrics, measured separately from generation. Recall@k and MRR against the
expected-source-chunk column answer "did the right chunk come back at all?" This is invariant 1 made measurable — quality is inherited forward, so you measure the earliest stage first — and it is why Part 4 insists you test retrieval separately before blaming the model. If recall@k is low, no prompt change will save you.
- Generation metrics. Groundedness (is every claim supported by the retrieved context?)
and relevance (does it answer the question asked?). In practice these are LLM-as-judge scores, which means your evaluator is itself a non-deterministic system and needs its own spot-check against human labels.
- Human feedback capture. A thumbs up/down on every answer, written to the same store as
your traces so you can jump from a complaint to the exact run.
- A regression gate. The eval suite runs in CI on every prompt, chunker, embedding-model or
k change, and fails the build on a drop. Without this step the other four are a science project, because the slide's promise — "see behavior changes before users complain" — is the gate, not the dataset.
The implementation patterns for the CI half of this land in the testing part of this guide; the LLM-as-judge and self-correcting-retrieval patterns land in the agentic-RAG part. What belongs here is the honest accounting: traces and metrics are solved by the source; evals are left to you.
What to instrument in a RAG pipeline, concretely
The source instruments a single llm.invoke. A RAG request has more surface. This table is the translation — apply @traceable at each of these boundaries and record these fields in extra_data:
| Span | Record | Why you will want it at 3 a.m. |
|---|---|---|
rag_request (outermost) | user_id, tenant, request_type, total latency, total cost | The join key for everything else; the unit your ROI number is per |
rewrite_query | original query, rewritten query | Tells you whether a wrong answer was answering a different question |
embed_query | model name and version, dimension, latency | Invariant 2 auditing — the only way to catch an index/query model drift |
vector_search | k, filter dict, returned ids, raw scores, store name | Scores are polarity-specific per store; log the raw value and the polarity |
keyword_search | k, returned ids, BM25 scores | Needed to attribute a fusion result to a branch |
fuse / rerank | rank before, rank after, model used | Proves whether your reranker is earning its latency |
assemble_context | chunk count, context tokens, whether truncation occurred | The dominant term in your bill and the usual cause of "the answer was in there somewhere" |
generate | model, prompt tokens, completion tokens, finish reason | Cost attribution and truncation detection |
validate_output | validation result, refusal flag | Distinguishes "model refused correctly" from "model failed" |
Checklist and decisions to make
Ship-blocking checklist — none of this is optional before real users:
uv add langsmith;LANGSMITH_API_KEYandLANGSMITH_TRACINGin.env;.envin
.gitignore.
- Decide who owns the tracing switch —
.envoros.environin code, never both. In
production, .env should win so you can disable tracing without a deploy.
LANGSMITH_PROJECTset to something meaningful, with separate projects per environment.- Verify you can see your own traces in the dashboard. Once, deliberately, before moving
on. Refresh the browser before concluding it is broken.
@traceableon the outermost request handler, and on every stage boundary in the table
above. Every traced function takes arguments and returns a value — otherwise the trace records empty input and null output.
user_id/tenant/request_typepassed as arguments so they become filterable
metadata.
- JSON structured logging (
JSONFormatter) on a named logger, with thehandlersguard
applied, an explicit stream (StreamHandler(sys.stdout) — the default is stderr), and a decided destination: Datadog, CloudWatch or Elasticsearch.
- A
MetricsCollector(or its Prometheus equivalent) recording all five per-call facts
through one method: latency, input tokens, output tokens, error, cache hit.
latency_sumandlatency_countstored separately. Ratios derived at read time, never
stored pre-averaged.
- Real provider token usage wired in, with the
words × 4 // 3heuristic demoted to a
fallback and labelled as an estimate wherever it surfaces.
- Every
exceptin the monitoring path ends inraise. Grep for it; this is a one-line
review that catches the whole class of "monitoring took production down."
- Every loop has a hard iteration cap in addition to its quality exit, and iteration count is
recorded as a metric so drift shows up before the invoice does.
- Alerts actually wired, not just metrics collected — the source's own file docstring
promises "structured logging, metrics, and alerts" and ships no alerting at all. At minimum: error rate over a rolling window, latency at your chosen percentile, cost per request against its trailing median, and eval-score drop between deploys.
- A golden set of at least twenty questions with expected source chunks, and a script that
prints recall@k.
- The passivity test passes. Delete the monitoring layer in a branch, run your test
suite, and confirm every response is byte-identical. If it isn't, monitoring is in your control flow and you have shipped a new failure mode instead of visibility into the old ones.
Decisions to make, and how to make them:
| Decision | Take the easy option when… | Take the harder option when… |
|---|---|---|
| Hosted tracing (LangSmith) vs self-hosted OTEL | You are on LangChain/LangGraph, prototyping, or a small team — two env vars beats a week of collector plumbing | Prompts or retrieved documents cannot leave your infrastructure, or you already run an OTEL/Grafana stack you must correlate with |
| Trace everything vs sample | Development, and any volume where cost and storage are irrelevant | High volume — then sample successful runs and keep 100% of errors and of low-eval-score runs, which is where the information is |
| Estimated tokens vs provider usage | Never, for money. Only for a local smoke test | Always, for anything anyone will make a decision from |
| Average latency vs percentiles | Day one, n is small, you need a number | The moment you have real traffic — a mean with a 17-second outlier in it (see the demo) is actively misleading |
| Metrics in-process vs a real backend | A single process, a demo, one container | More than one replica — an in-process dict resets on every restart and cannot be aggregated across instances |
| Build evals now vs later | Never "later" — twenty questions is an afternoon | Always now. It is the only pillar that measures correctness, and it is the one the source leaves you to build |